
Snapshot
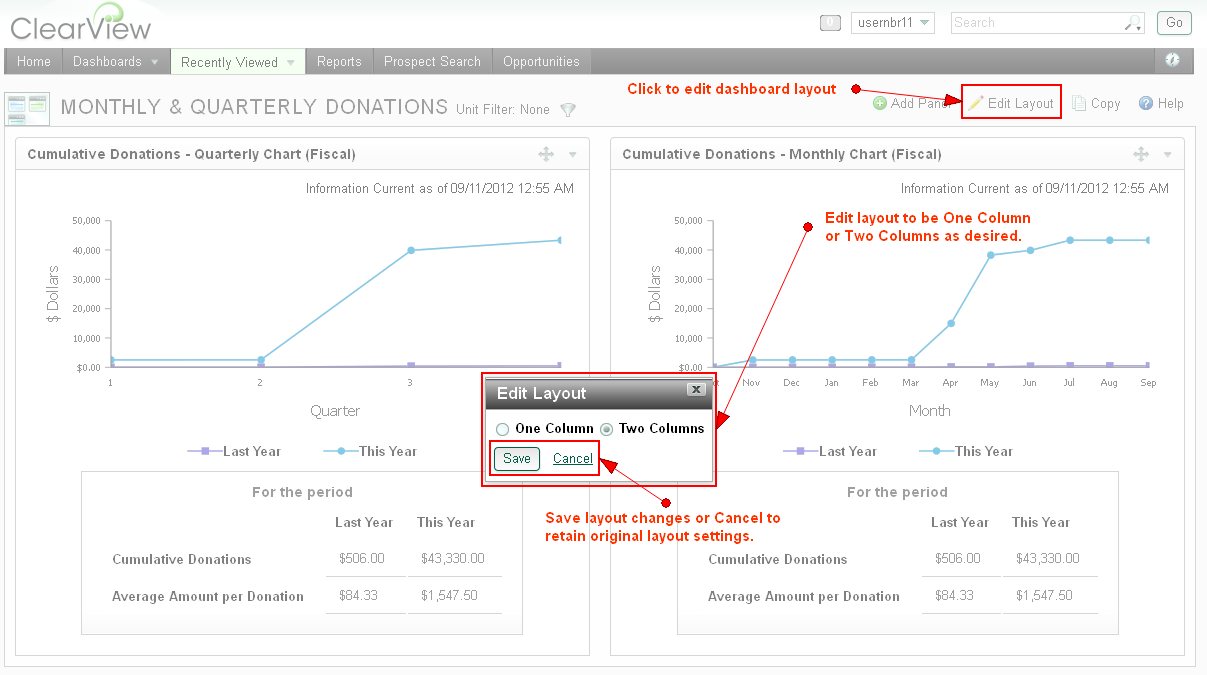
About dashboardsDashboards are workspaces that display the information that is most important to you and to your various duties. They are a place where you can “pin-up” information, in a manner of speaking, like to-do lists, graphs, and other data formats. Dashboards allow you to receive notifications, see key lists of items, and review summary charts and graphs. Think of your primary dashboard as a way to design your own homepage. Create additional dashboards that focus on specific topics, tasks, or types of data. Dashboards are organized into panels. Panels are like mini-reports, displaying at-a-glance information on a particular topic of interest, oftentimes related to a certain type of record. Data-driven panels are intended to offer a quick glimpse of the numbers, with some providing access to more detailed records. Task-oriented panels display synopsis information that acts as a portal to full records.
Dashboards can be organized and configured in a way that best supports your own responsibilities. The possibilities are vast, giving you the power to customize your workspace to meet your own optimal productivity goals. |
(click image to enlarge) |


![]() Privileges to access features or to personalize configurable ones can vary by user, as well as by role, and are determined by your organization. If you have questions about your privilege settings, contact your administrator.
Privileges to access features or to personalize configurable ones can vary by user, as well as by role, and are determined by your organization. If you have questions about your privilege settings, contact your administrator.